A picture is worth a thousand words. Based on our recent Golden/TIPP Poll data, we created eight charts that answer the following questions:
Do elected officials in Washington represent Americans’ views and values?
How satisfied are Americans with their elected leaders?
Do Americans see the difference between the two major parties?
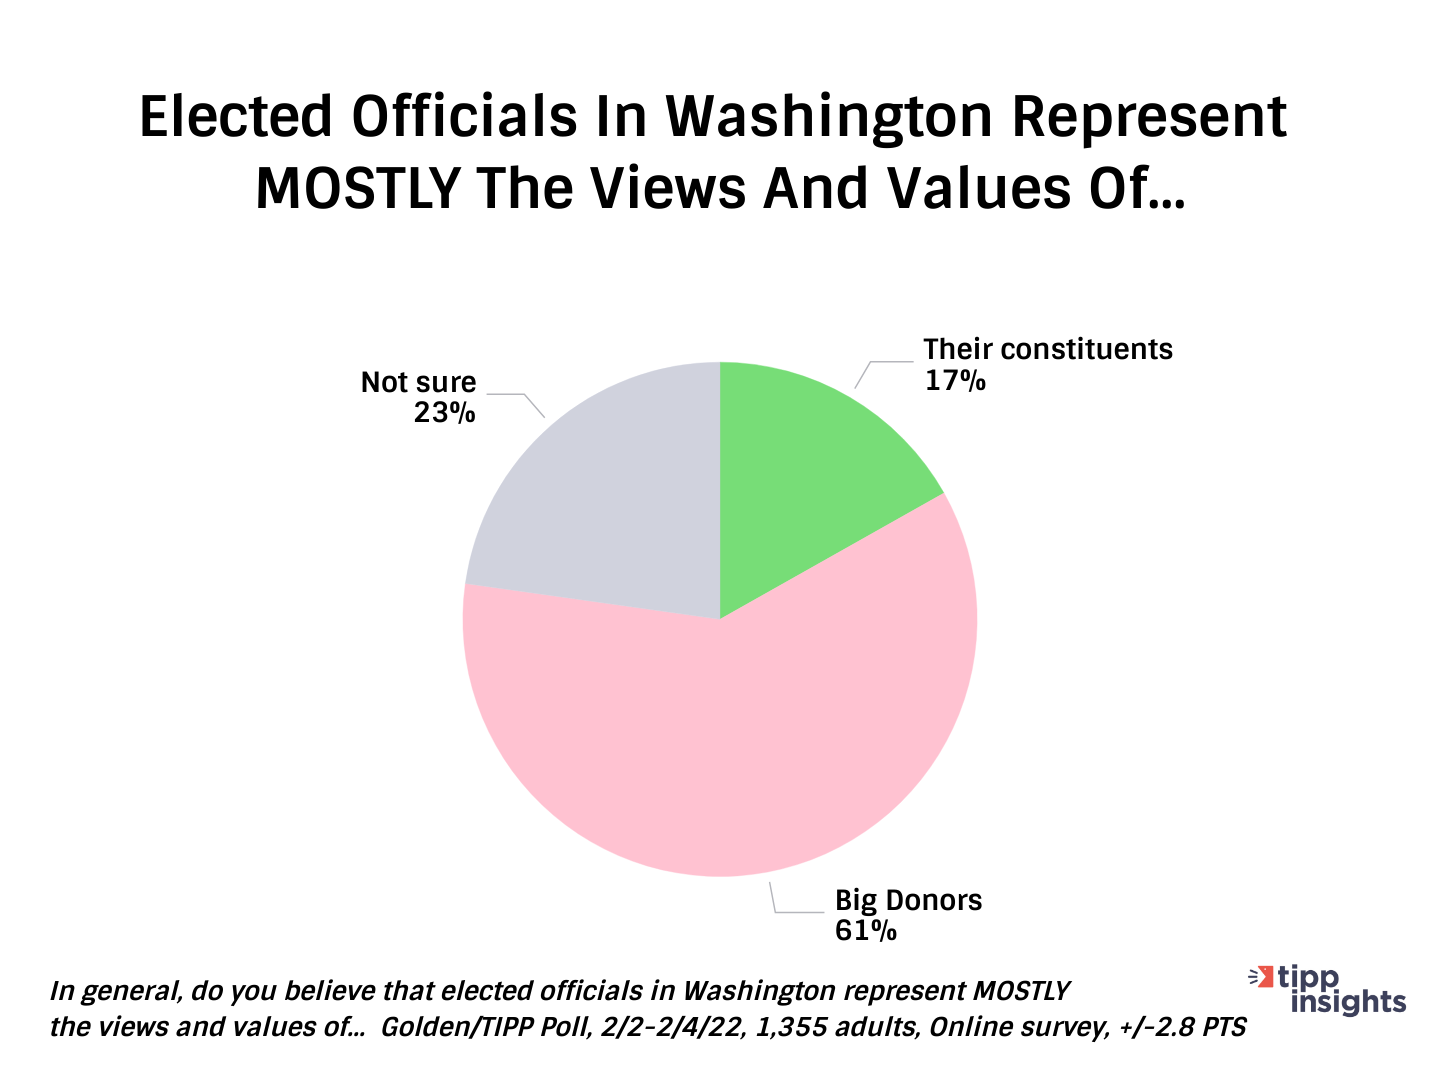
Big Donors Vs. Constituents
More than six out of ten (61%) think that elected officials in Washington mostly represent the views and values of big donors. About one in six (17%) believe elected leaders represent their constituents. And 23% are not sure.
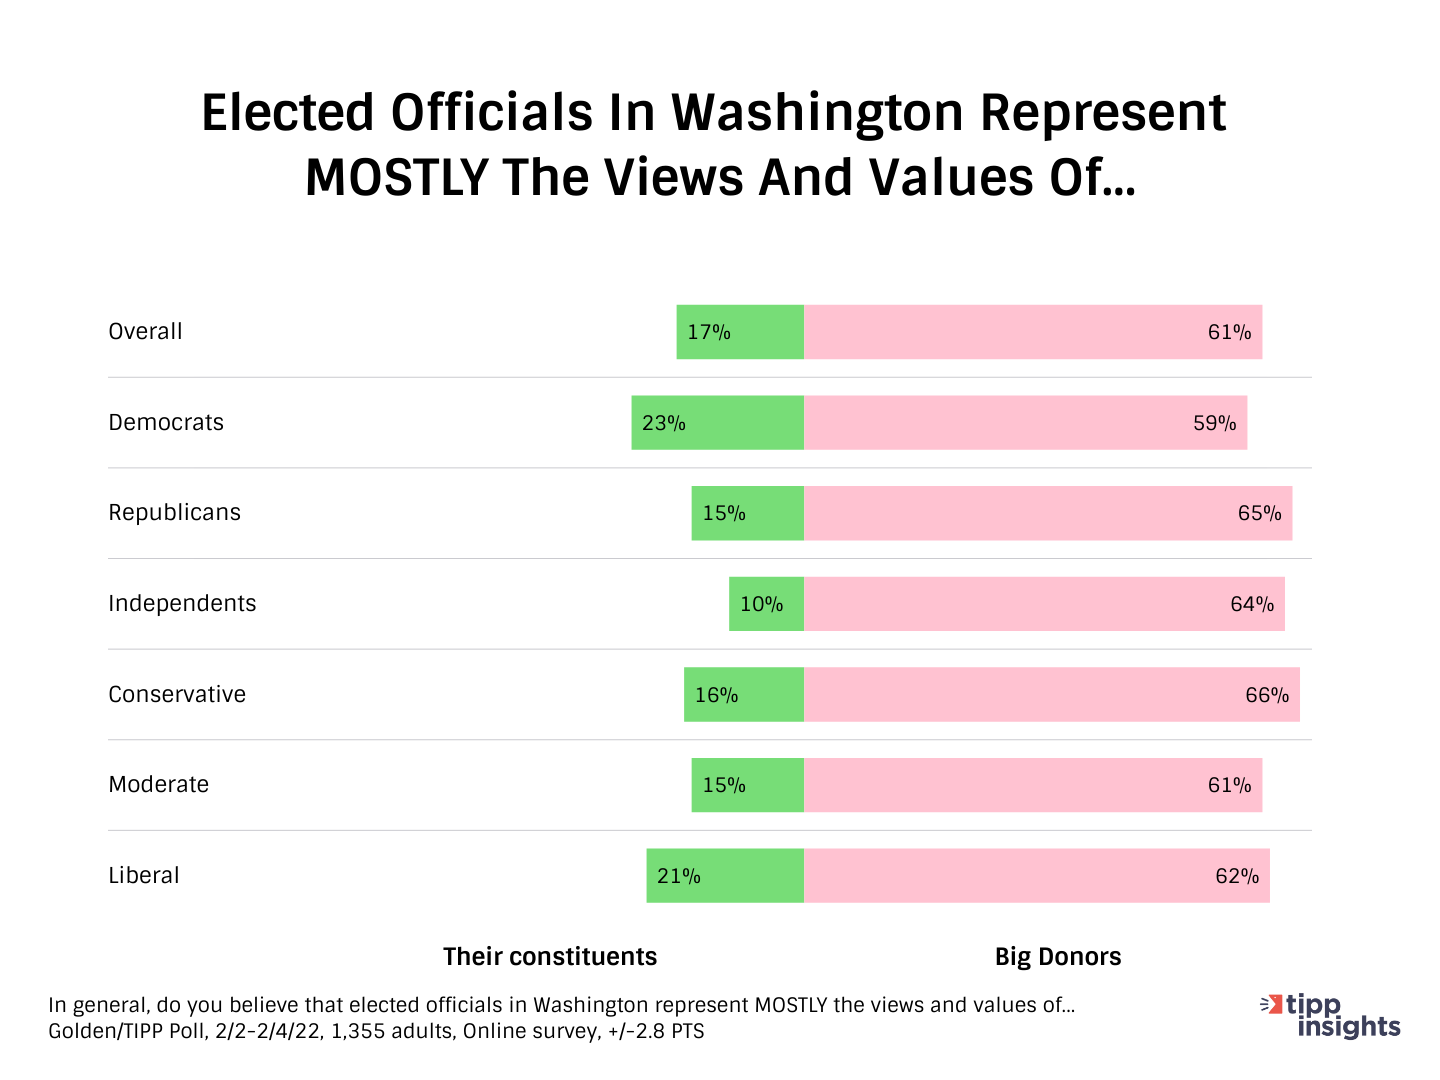
Most Americans of all political spectrum agree that politicians represent their donors and not their constituents.
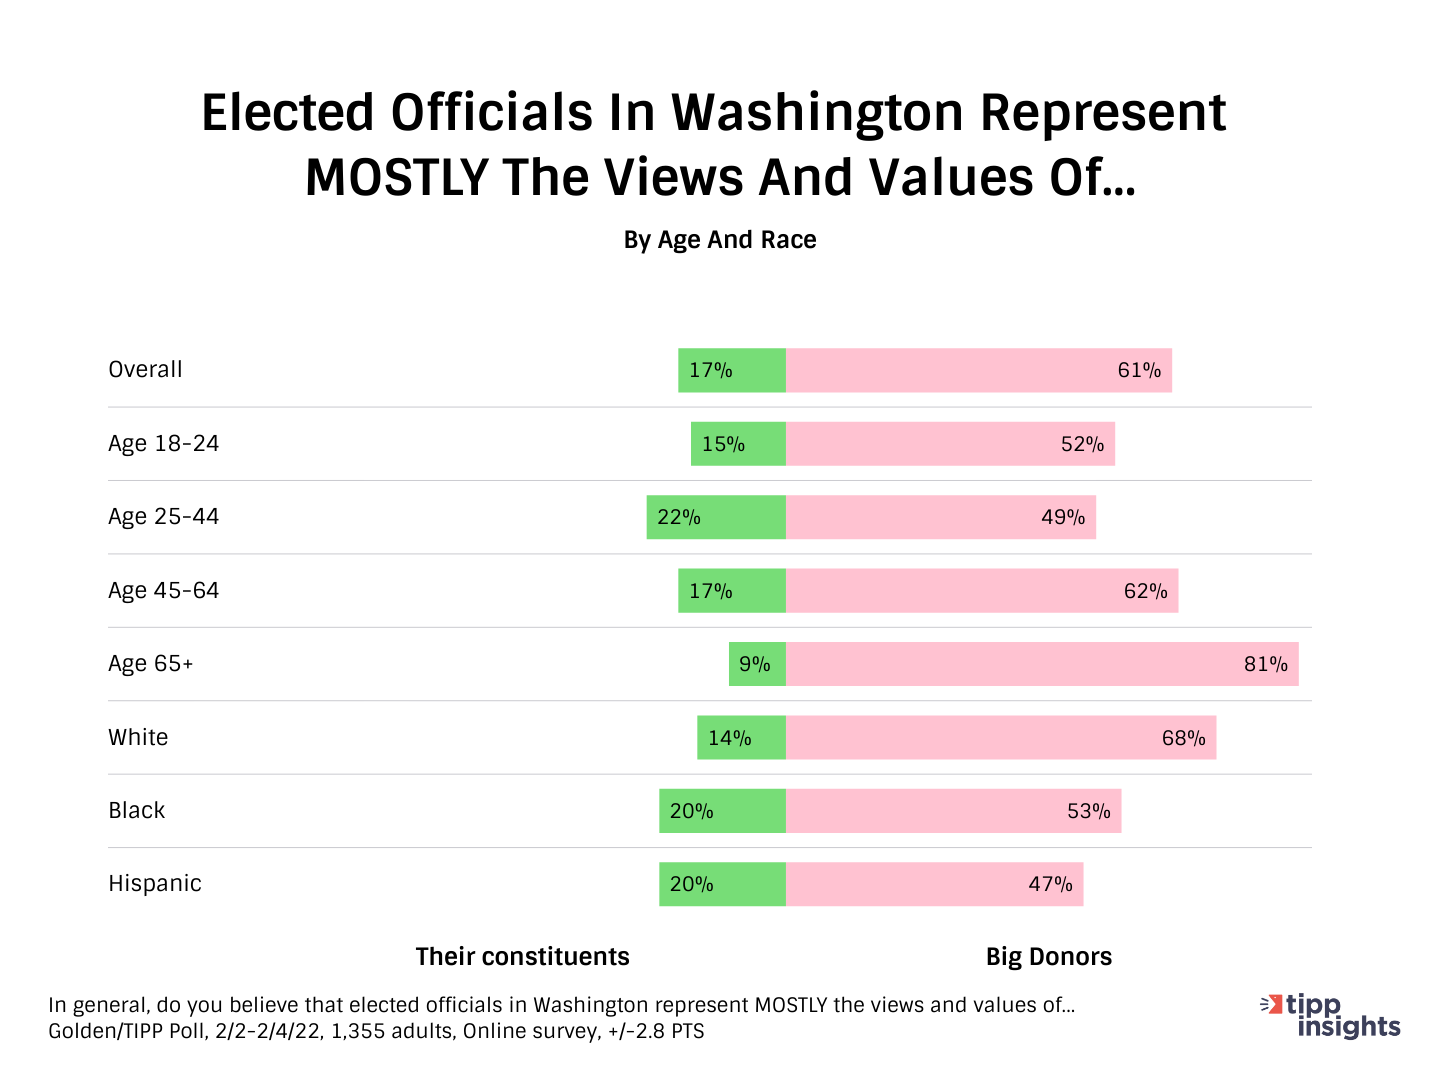
As age increases, the share of those who believe that their leaders are in it for their big donors also increases. A larger percentage of White Americans (68%) are skeptical, compared to 53% of Blacks and 47% of Hispanics.
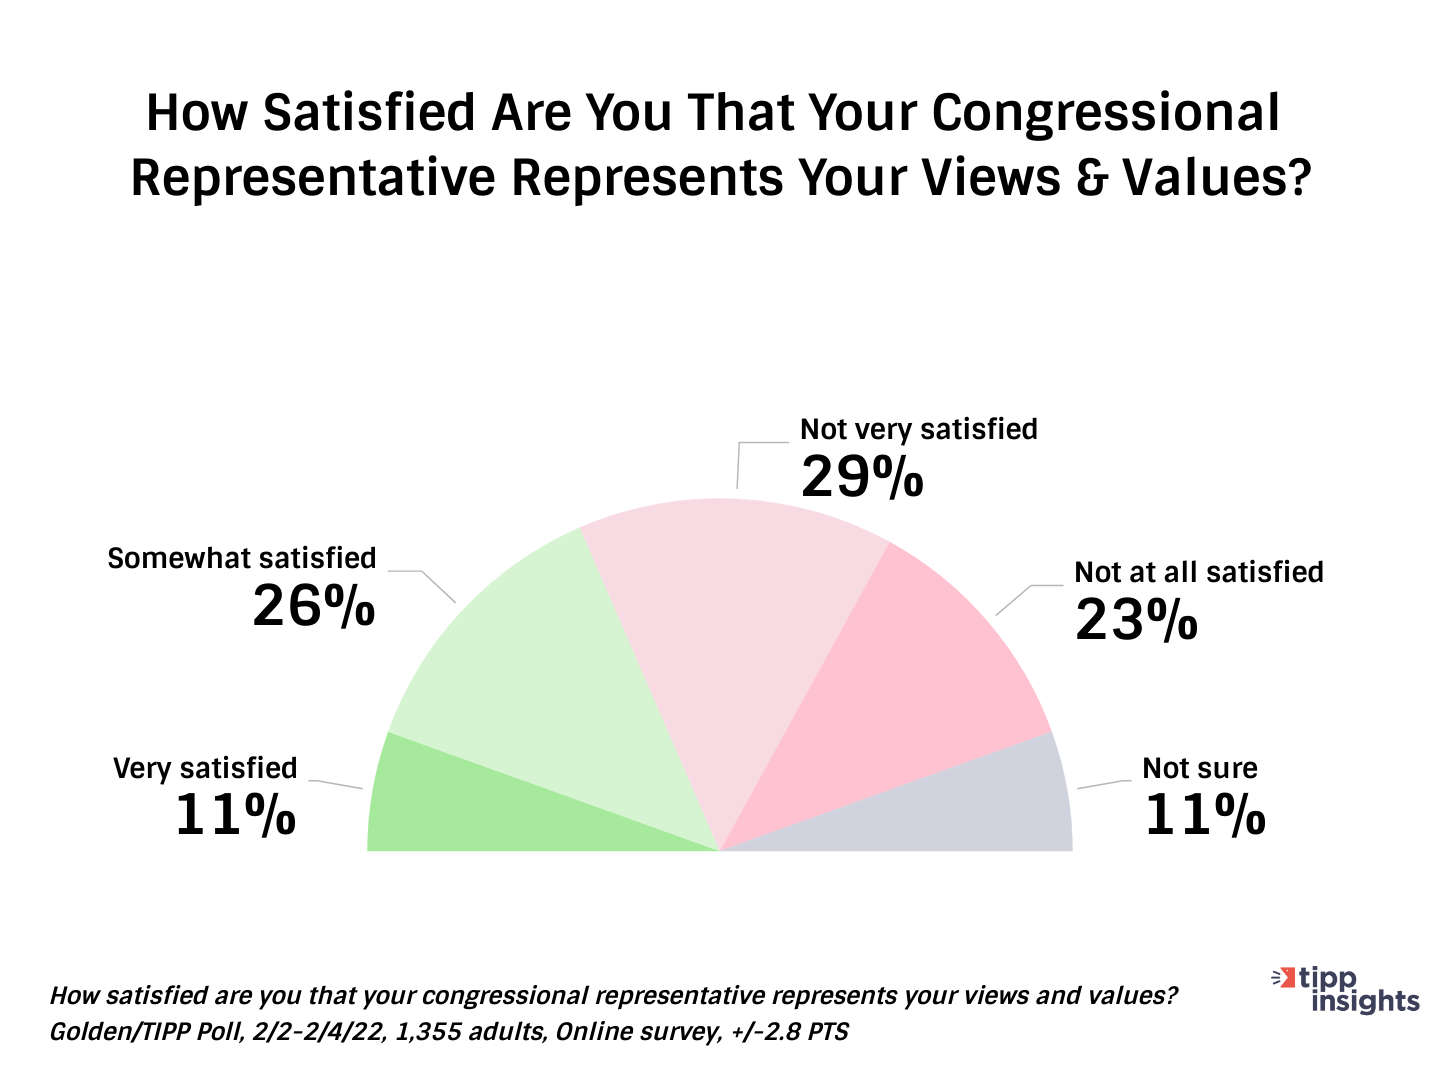
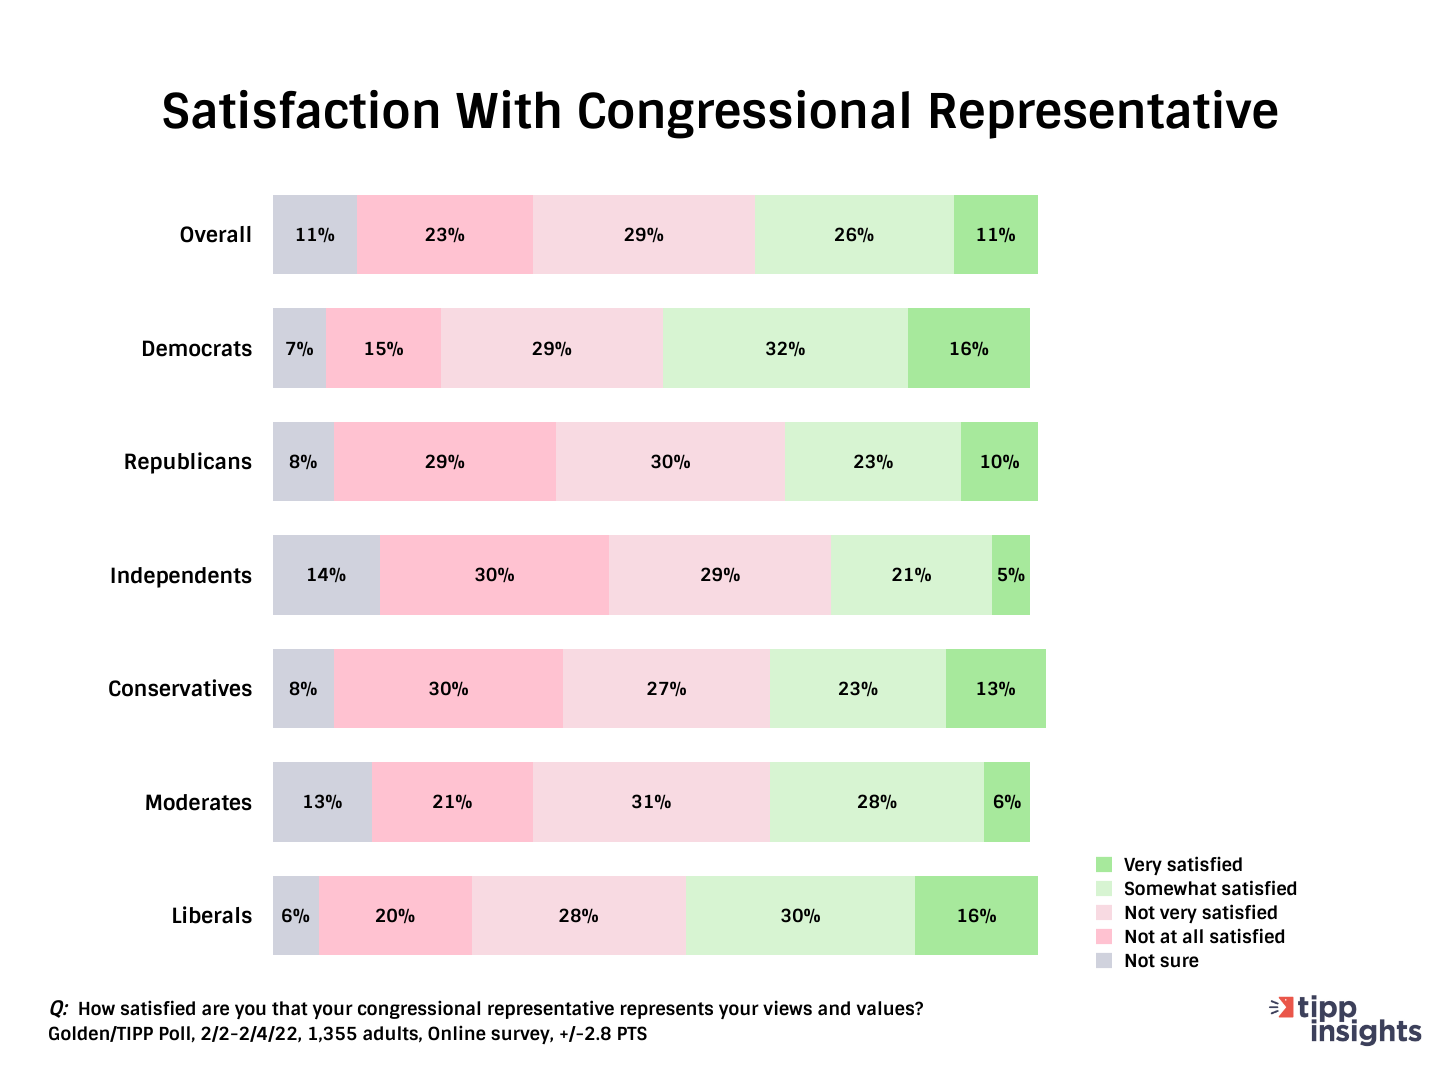
Satisfaction With Congressional Representative
Most Americans (52%) are dissatisfied with their congressional representative’s representation of their views and values. Only 37% are satisfied. Another 11% are not sure.
By party and ideology, not a single group posts satisfaction above 50%. The dissatisfaction is highest among Republicans and Independents. Also, most conservatives and moderates are dissatisfied. Over four in ten Democrats (44%) and nearly one-half (48%) of liberals are disappointed. Here are the dissatisfaction levels by party and ideology.
ADVERTISEMENT
44% of Democrats
59% of Republicans
59% of Independents
57% of conservatives
52% of moderates
48% of liberals
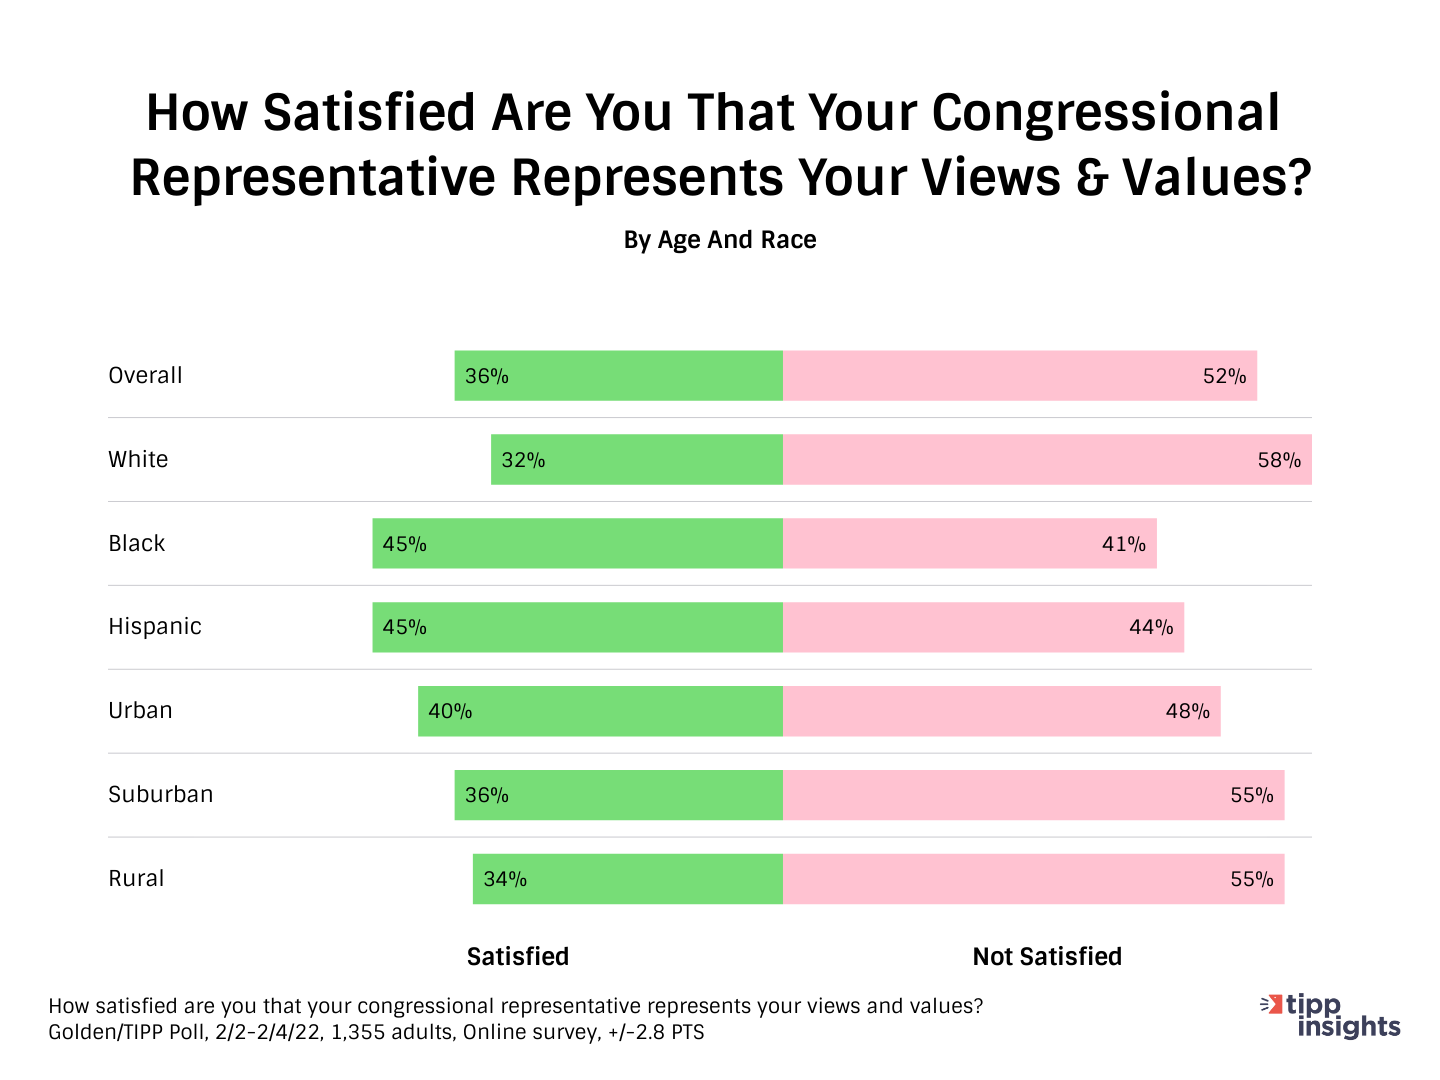
The dissatisfaction is higher among White Americans (58%) compared to Blacks (41%) and Hispanics (44%). Also, those living in suburban and rural areas are more likely to be dissatisfied than urban residents.
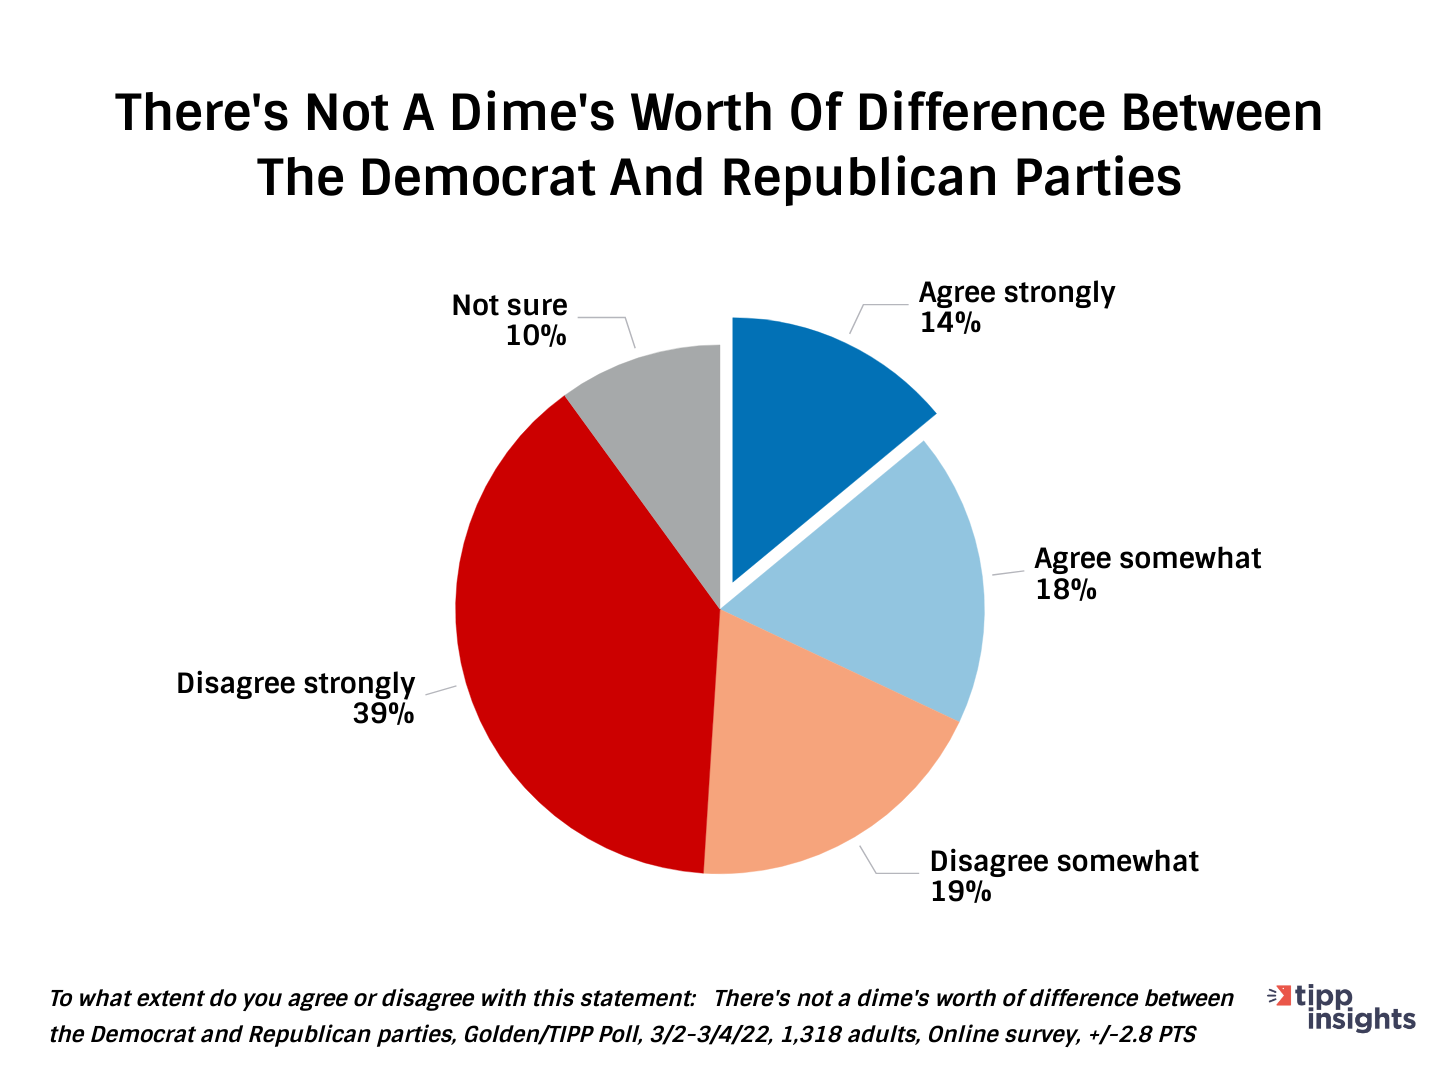
Perception Of The Two Parties
Despite their dissatisfaction with politicians, most Americans (58%) believe there are differences between the two parties. Roughly a third (32%) think there is no difference between the two parties. Another 10% are not sure.
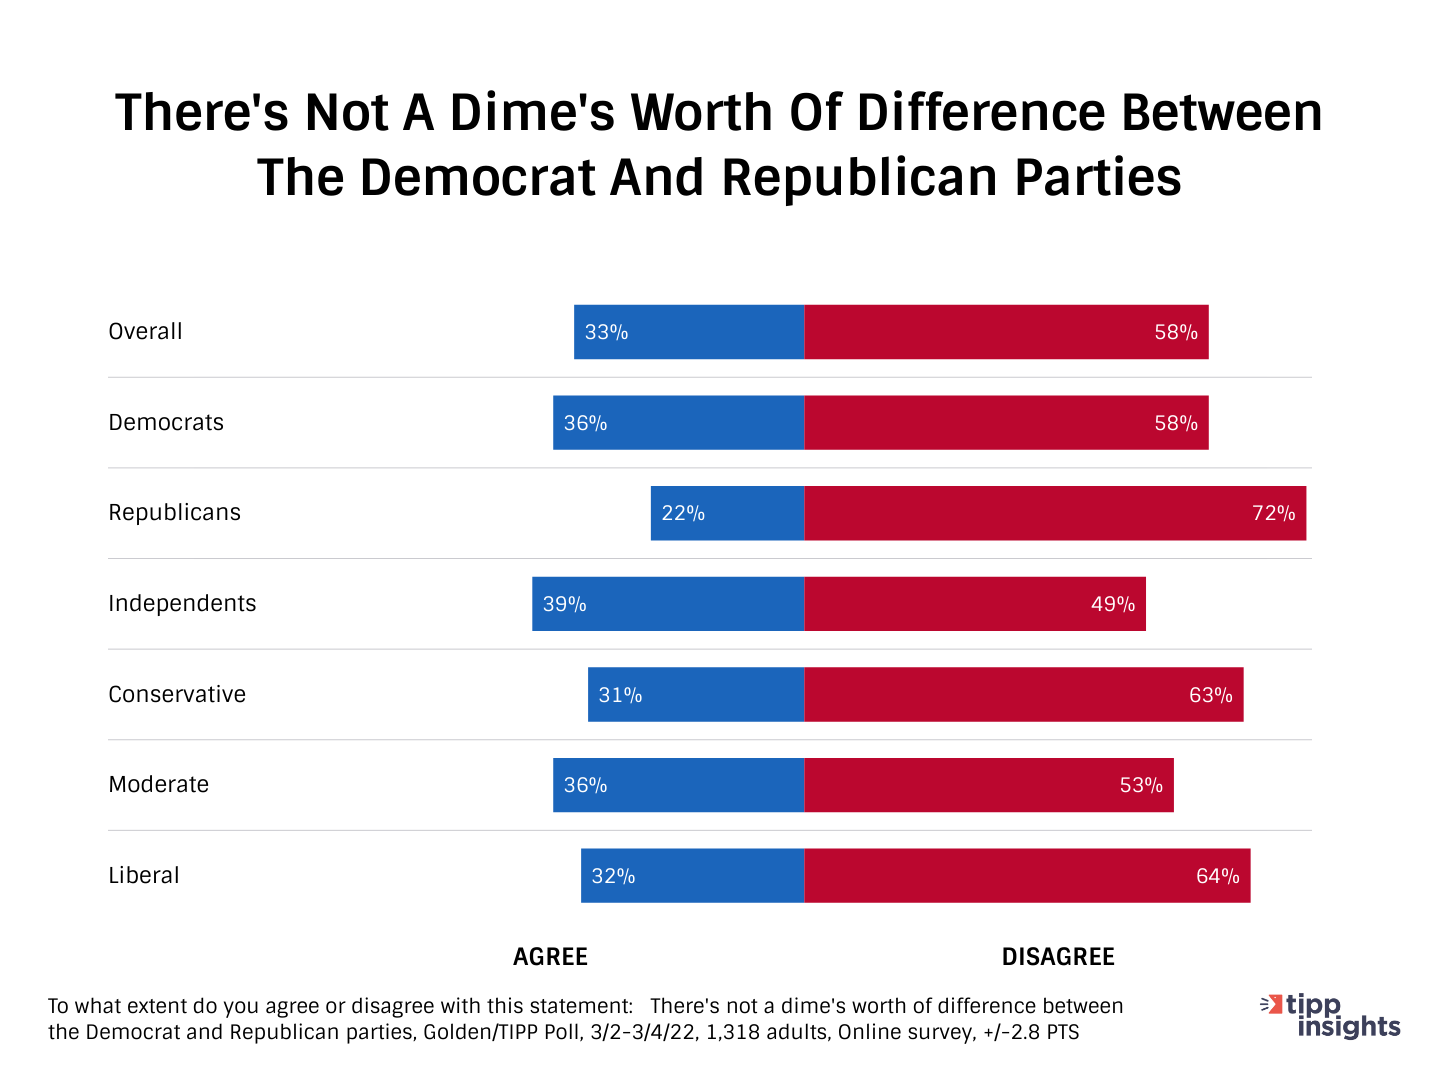
A majority of all political and ideological differences, except independents, see the difference between the two parties. Republicans (72%) and conservatives (63%) are most likely to know the difference. Independents (49%) and moderates (53%) are the least likely. Democrats (58%) and liberals (64%) are between the two.
The data sends a clear message to politicians. Serve your constituents over big donors. Americans’ unhappiness may eventually catch up with you.
We have no tolerance for comments containing violence, racism, profanity, vulgarity, doxing, or discourteous behavior. If a comment is spam, instead of replying to it please click the ∨ icon below and to the right of that comment. Thank you for partnering with us to maintain fruitful conversation.